Investigating the Influence of Anthropogenic Forcing and Natural Variability on the 2014 Hawaiian Hurricane Season
This is a short summary of paper Murakami et al. (2015) [1].
1. Introduction
Three tropical cyclones (TCs) approached the Hawaiian Islands during the 2014 summer season (Fig.1). In this study, we used a suite of climate experiments using the Geophysical Fluid Dynamics Laboratory (GFDL) Forecast-oriented Low Ocean Resolution model (FLOR) to explore whether the unusually large number of Hawaiian TCs in 2014 was made more likely by anthropogenic forcing or natural variability. Understanding the physical mechanisms leading to the extreme events in a specific region is a key NOAA goal and highly relevant to society.
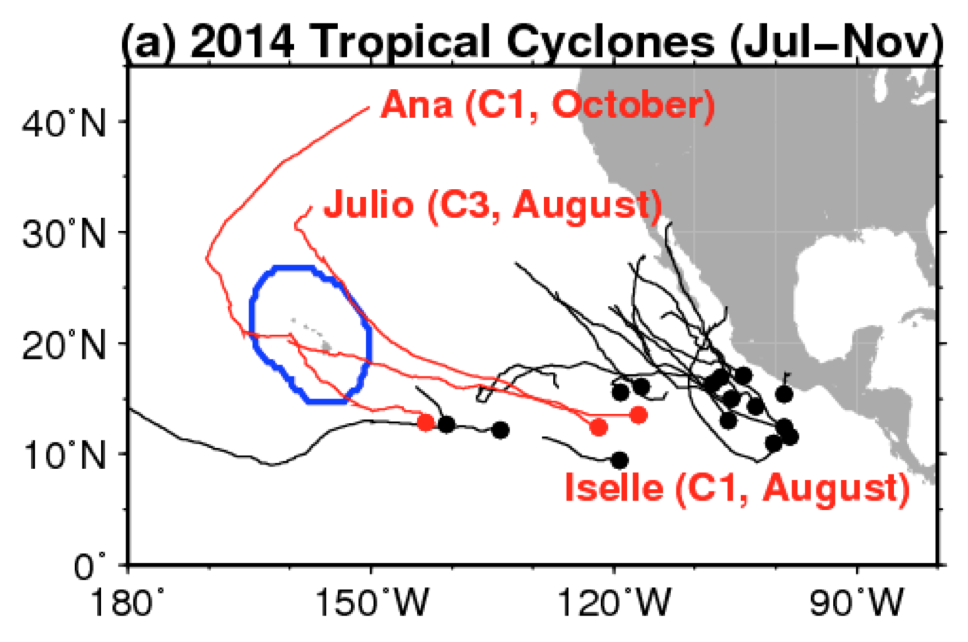
Fig. 1. Observed tropical cyclones in 2014. Three TCs (red color; Iselle, Julio, and Ana) approached the coastal region of Hawaii (blue). Dots denote TC genesis locations.
2. Key Findings
The key findings are summarized as follows.
- A 1990 control experiment substantially increased the probability of TC frequency near Hawaii relative to an 1860 control experiment by a factor of 5~20, or a fraction of attributable risk of 80~94% (Fig.2). These experiments suggest that anthropogenic forcing has substantially changed the odds of TC seasons like 2014 near Hawaii relative to natural variability alone.
- The observed multi-decadal difference in TC frequency near Hawaii between 1980–1994 and 1995–2014 was mainly caused by natural variability.
- It is likely that global warming has increased the odds of the extremely large number of Hawaiian TCs in 2014, in combination with the moderately favorable condition of El Niño.
The ensemble future experiments indicate a continued increasing probability of active seasons around Hawaii over the next few decades – though will substantial modulation on interannual and decadal timescales from internal variability.
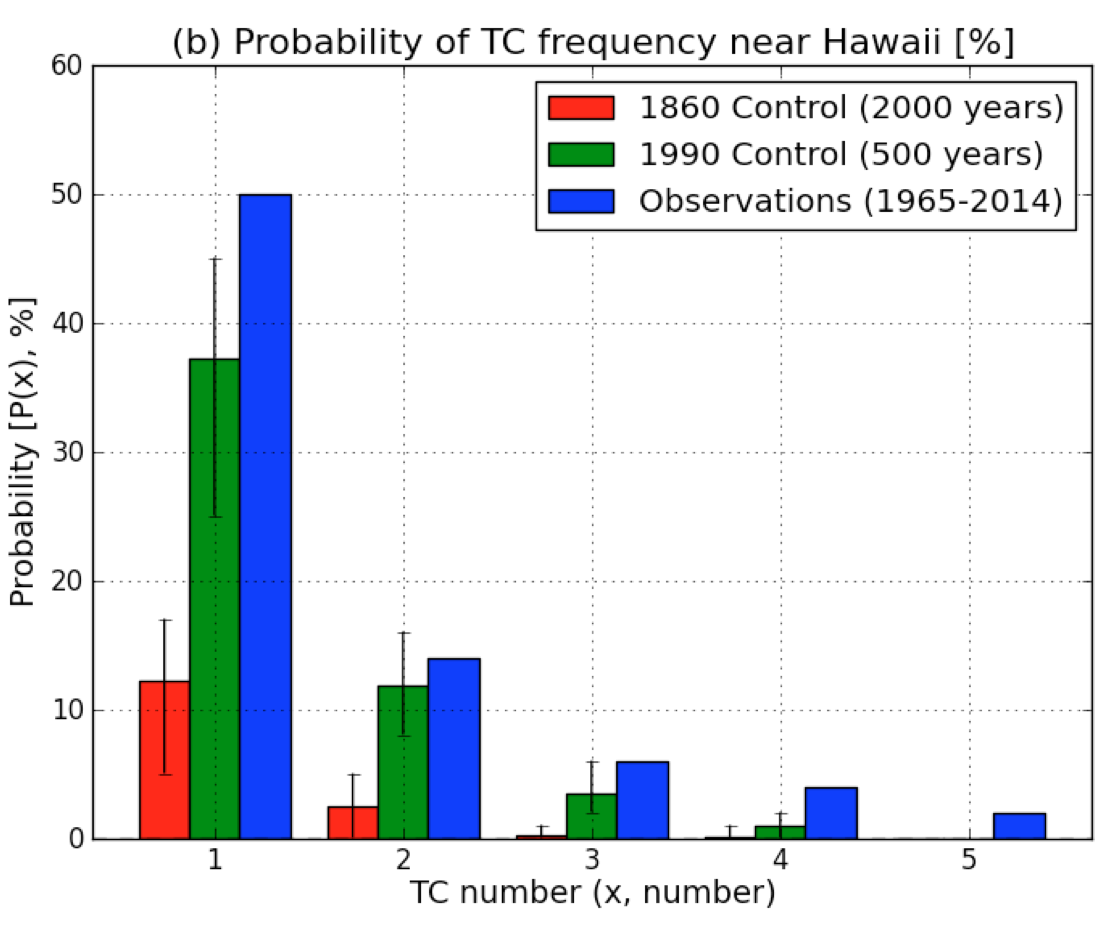
Fig. 2. Results of probability of a year with TC frequency near Hawaii simulated by the control experiments and observations. Blue bars are probability obtained by observations (1965–2014). Green bars are the results by the 1990 control simulation (500 years), whereas red bars are the results by the 1860 control simulations (2000 years). P(x) represents the probability of occurrence of the year with TC number more than or equal to x near Hawaii.
3. Reference
![[pdf]](http://www.bamboodream.sakura.ne.jp/hiroblog/wp-content/plugins/papercite/img/pdf.png)
[Bibtex]
@Article{MURAKAMI2015B,
author = {H. Murakami and G. A. Vecchi and T. L. Delworth and K. Paffendorf and R. Gudgel and L. Jia and F. Zeng},
title = {Investigating the influence of anthropogenic forcing and natural variability on the 2014 Hawaiian hurricane season. [in "Explaining Extremes of 2014 from a Climate Perspective"].},
journal = BAMS,
year = 2015,
volume = 96(12),
pages = {S115-S119},
pdf = {/hiroblog/wp-content/papercite-data/pdf_paper/Murakami_etal_2015B_BAMS.pdf},
doi = {10.1175/BAMS-EEE_2014_ch23.1},
}