Seasonal Prediction of Heavy Rainfall over the Western United States in 2017 Winter by
GFDL Coupled Climate Models
1. Abstract
The wet conditions during January–February 2017 over the western US, including heavy rain in California, were predicted by some of ensemble members by a suites of GFDL global coupled models owning to the successful prediction of synoptic cold air inflows from the arctic region associated with meandered jet stream.
2. Introduction
The anomalous wet conditions during January–February 2017 over the western US (Fig. 1a) brought not only water supply in the biggest reservoirs in California, but also huge socio-economic damage due to floods. The seasonal prediction models developed at GFDL could predict the wet conditions in the western US one or two months in advance (Fig. 1b). The detailed results show that some forecast configurations successfully predicted the wet conditions (e.g., FLOR-FA-p3 and CM2.1R), whereas some of ensemble members failed to predict (Fig. 1c). It is of great scientific interest to address the key factors responsible for the successful prediction.
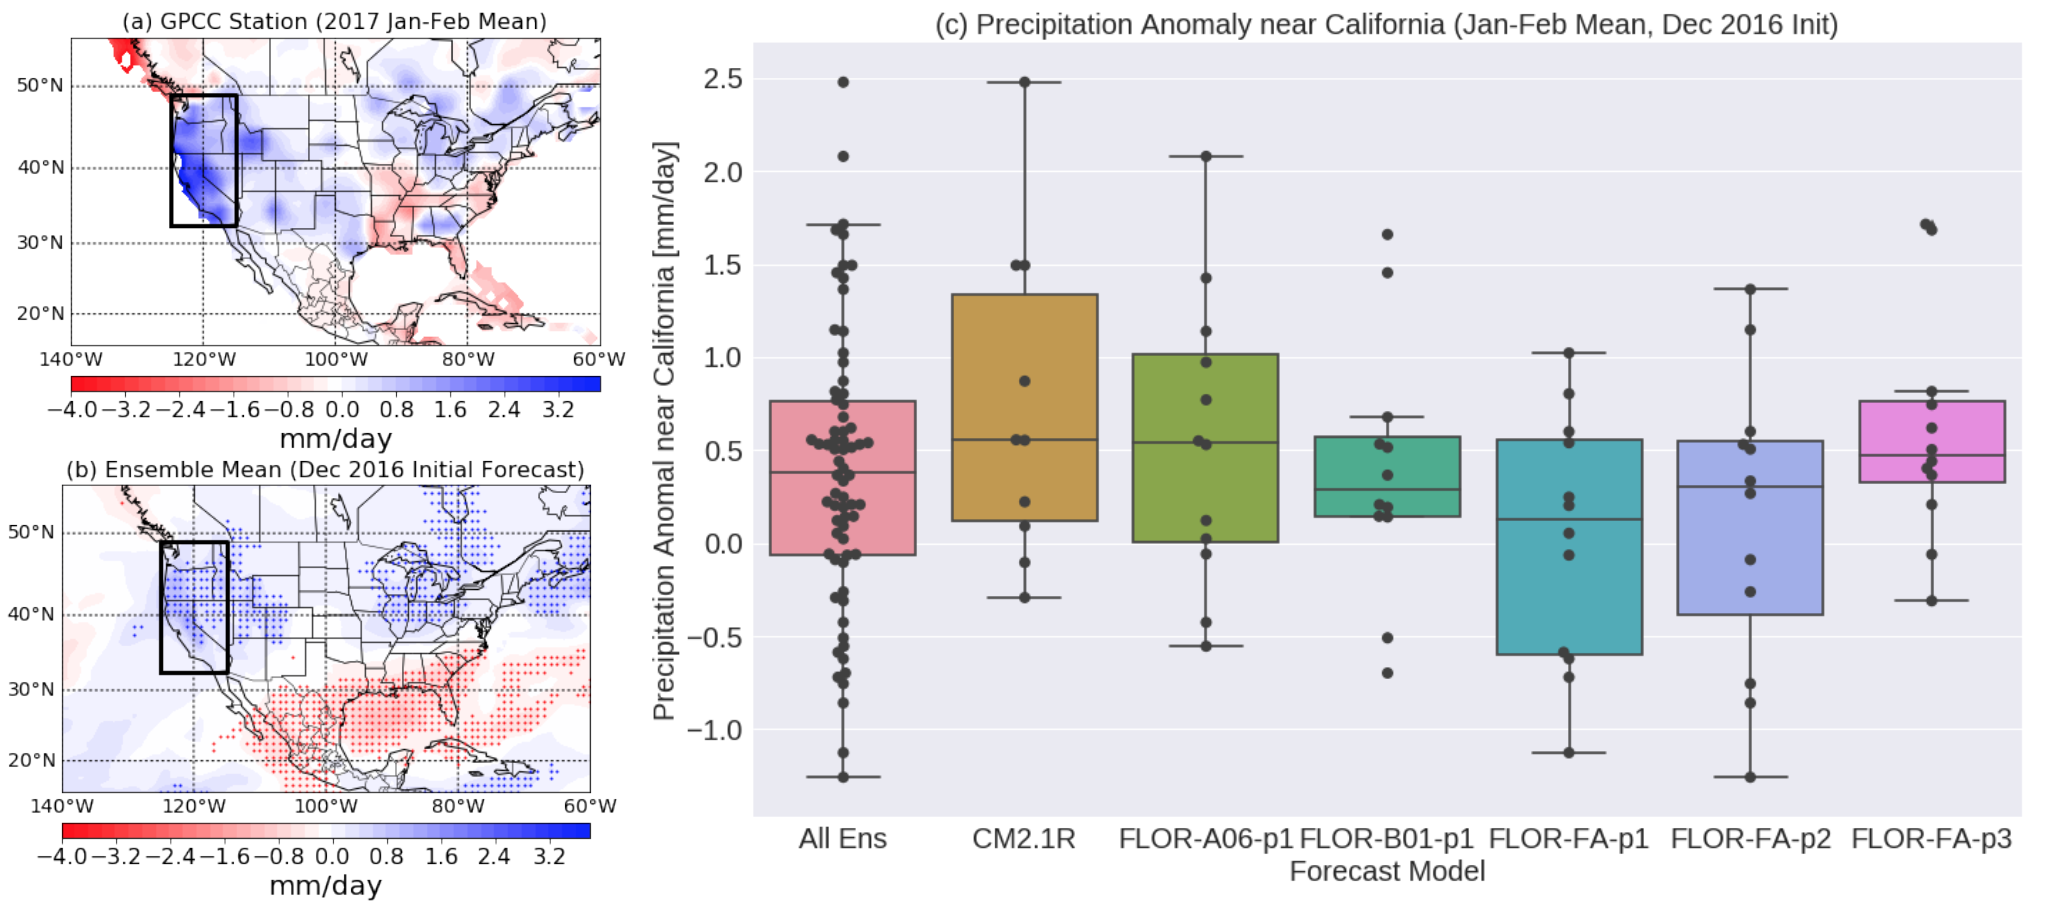
Fig.1 (a) Observed anomaly of 2017 Jan–Feb mean precipitation [mm/day]. (b) As in (a), but for the ensemble mean of prediction initialized on 2016 Dec. Dot marks in (b) indicates that the predicted mean value is significantly different from zero value by a statistical test. (c) Box plots of the predicted area mean precipitation anomaly over the western US (rectangle domain in a, b). Black dots in (c) indicate value from each member. There are forecast results by GFDL CM2.1 (CM2.1R) and FLOR with five different configurations (FLOR-A06; FLOR-B01-p1; FLOR-FA-p1; FLOR-FA-p2; and FLOR-FA-p3). Combined results for the all predictions are shown in “All Ens”.
3. Detailed Analysis
Figures 2a–c reveal the observed mean anomalies of precipitation, sea surface temperature (SST) and geopotential height at 500 hPa (Z500) during Jan–Feb 2017, respectively. The observed SST anomaly (Fig. 2b) shows a slightly cold SST anomaly over the central Pacific, associated with La Niña condition, in addition to the warm subtropical Pacific anomaly. Moreover, the observed Z500 anomaly (Fig. 2c) shows a wave pattern (H–L–H) associated with so-called negative phase of Pacific North Atlantic (PNA). Given the persistent low pressure near the north-western US during the season, jet stream meanders and cold air inflows from the arctic region, that in turn destabilizes atmosphere, leading to frequent events of heavy rain over the western US.
Among the 70-ensemble-member forecasts, composites were made using the best 15 members (P+) that correctly predicted positive precipitation anomaly in the western US (Figs. 2d–f), and the worst 15 members (P–) that erroneously predicted negative precipitation anomaly in the western US (Figs. 2g–i). It turned out that there is no difference in the predicted mean SST anomaly between the two composites (Figs. 2e,h), suggesting that the difference in the mean precipitation was not caused by the different prediction of ocean state. However, there is a clear difference in the predicted Z500 field (Figs. 2f, i). The P+ members show the wave pattern (Fig. 2f) as observed (Fig. 2c), whereas the P– members show a zonally symmetric positive Z500 anomaly (Fig. 2i).
Although we found that the key for the successful seasonal prediction of the western US heavy rainfall lies in the prediction of atmospheric wave pattern, it is not clear if the forecast models have robust skill in the prediction given the large ensemble spreads shown in Fig. 1c. Further study is needed to address predictability of wave pattern that in turn lead to accurate prediction of hydrology in the western US.
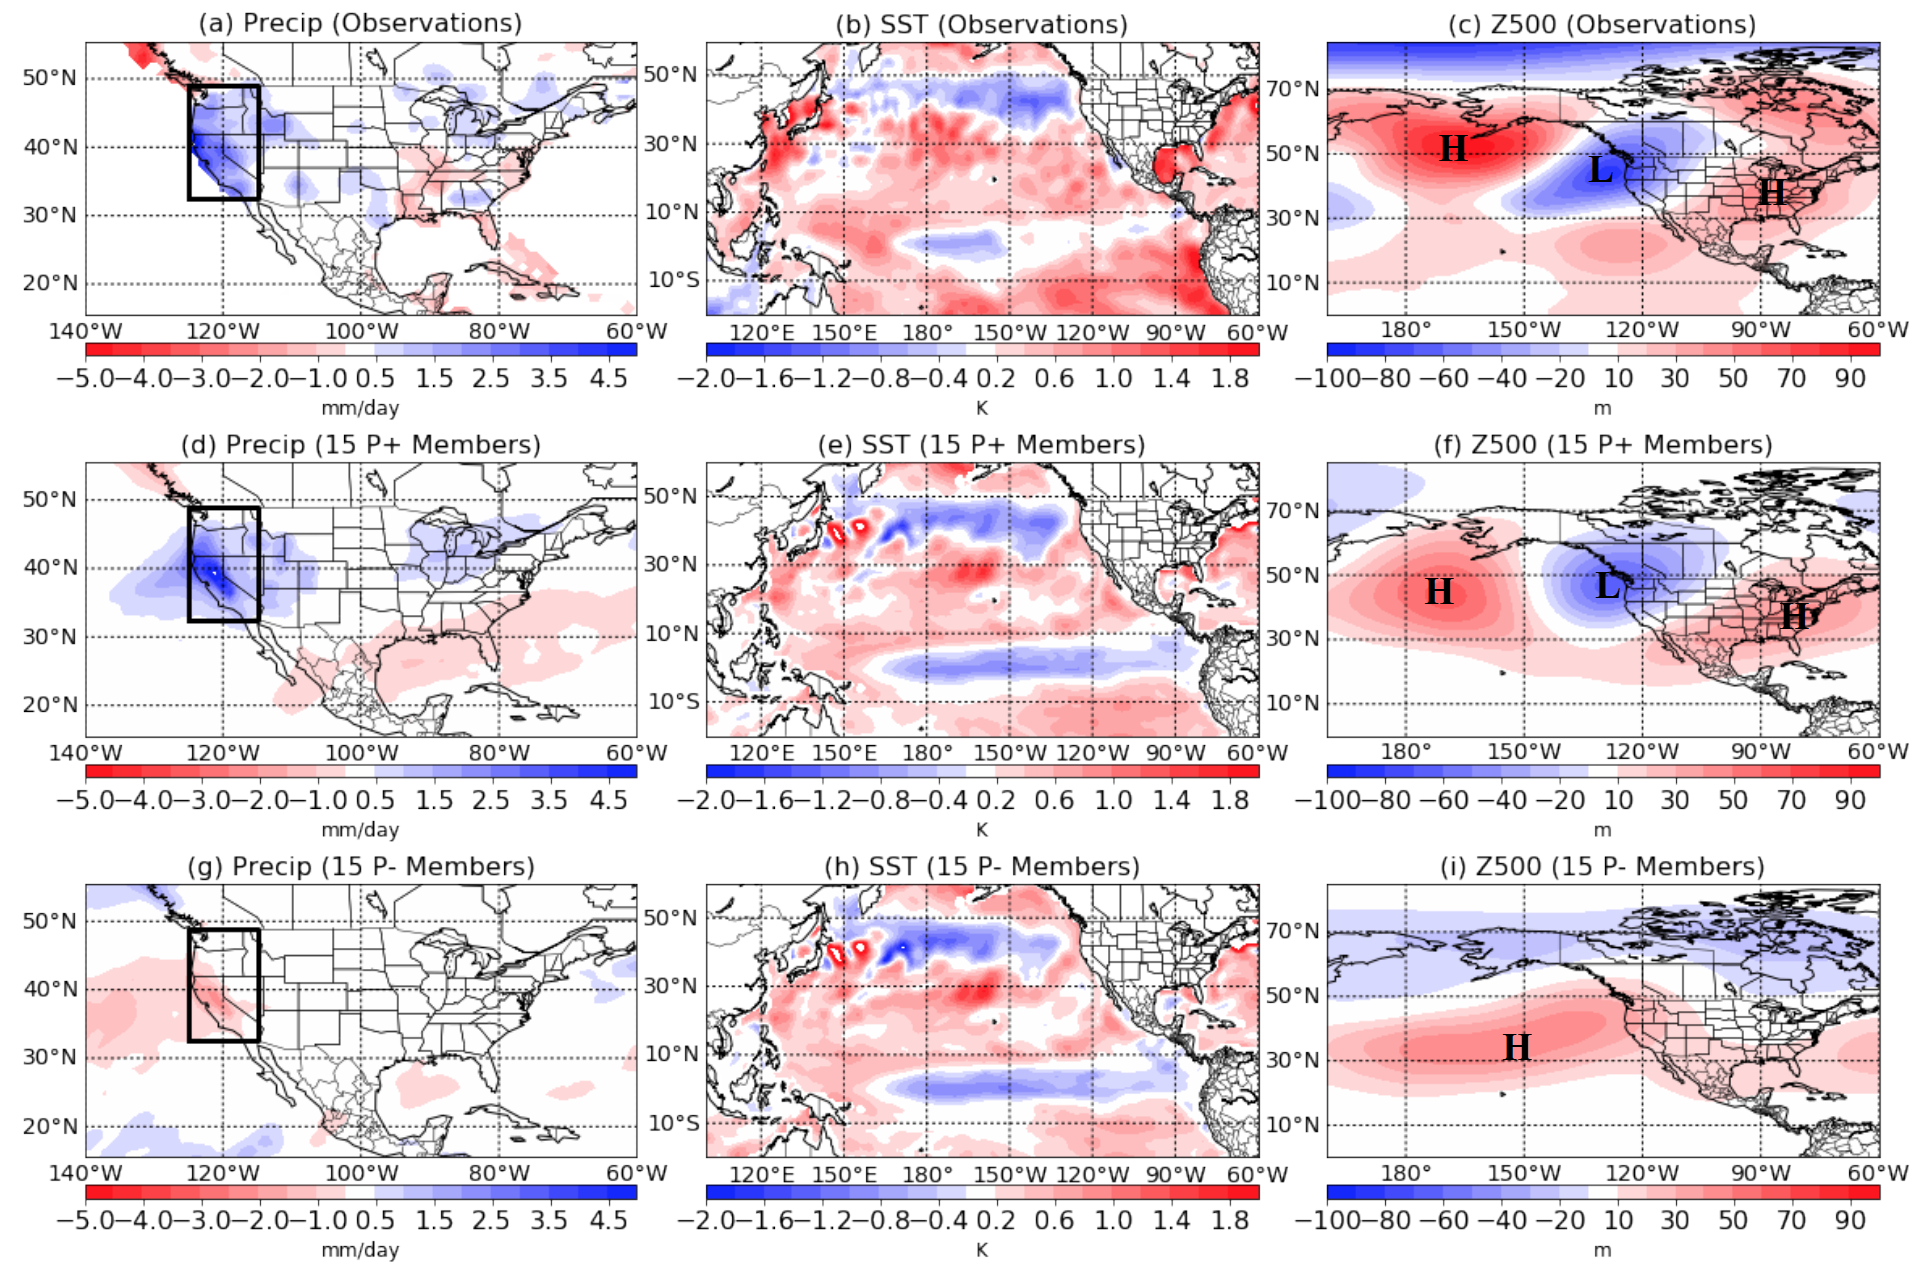
Fig. 2 (a) Observed anomaly of 2017 Jan–Feb mean precipitation [mm/day], (b) SST [K], and (c) geopotential height at 500 hPa [m]. (d)–(f) As in (a)–(c), but for the composites for the best 15 members (P+) predicting positive precipitation anomaly in the western US. (g)–(i) As in (d)–(f), but for the worst 15 members (P–) predicting negative precipitation anomaly in the western US. H and L in Figs. 2c,f, and i denote high and low anomalies, respectively.